Which do you practice: the “50/70 Rule” or the unreliable “50/50 Rule”?
by Neal Whitten, PMP, Contributing Editor
HAVE YOU EVER NOTICED that the “linear 50/50 rule” doesn’t seem to work well on your projects? That is, if you have an activity such as Prepare the Product’s Documentation, Code the Product’s Modules, or Run the System Test Scripts, when half of the allotted time for the activity has elapsed, you are 50 percent completed with the activity. Yet, when the remaining 50 percent of the time expires, the activity has not completed? This is a common problem on projects with activities that are made up of multiple so-called equivalent-weighted tasks.
For example, if we have 100 pages of material to write in 20 days (Prepare the Product’s Documentation), we expect the progress of writing the pages to represent a linear progression. That is, each page takes the same amount of time to write and that five pages can be expected to be completed every day. But the reality is that if you are only 50 percent complete with an activity when half the time has elapsed, the activity is almost certain to be completed late.
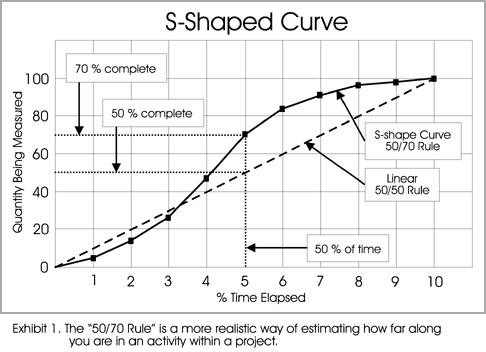
So, what can we do different? When planning an activity made up of many tasks that are approximately of the same level-of-effort, do not use the linear 50/50 rule. Instead, use the “S-shape curve 50/70 rule.” That is, when 50 percent of the time has elapsed, 70 percent of the work must have been completed. The remaining 30 percent of the work must be completed in the remaining 50 percent of time.
Let’s look at the exhibit to better understand what happens. The S-shape curve is common for planning many types of endeavors. It suggests that progress usually is slow at the start of an activity, builds to a peak when productivity is at its very best, and then slows again during the more difficult phase of completing the activity. Almost every activity you take on in life tends to play out this way. This is why many of us say we are on schedule midway into an activity, and believe we are, yet often are late in completing the activity.

THE NEXT TIME you are creating a plan for yourself, or are working with your team or project members in creating a plan, make sure that your plan takes into account the realities of the S-shape curve. Furthermore, when your progress is being tracked, show the planned progress as an S-shape curve where the vertical axis depicts the quantity being measured, such as the number of pages to be written, modules to be coded, or test scripts to be run. Then report your actual progress against your plan that is depicted as an S-shape curve.